Suppose the monthly charge for cell phone plans is normally distributed with mean µ = ![]() 21.
21.
(a) Draw a normal curve with the parameters labeled.
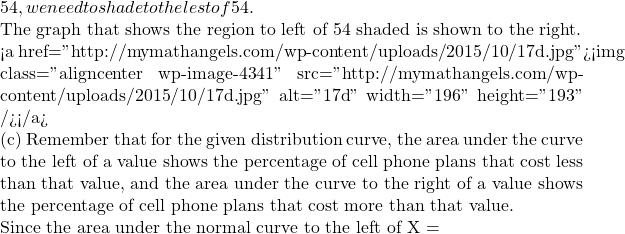
(b) Shade the region that represents the proportion of plans that charge less than ![]() 54 is 0.1587. Provide an interpretation of this result.
54 is 0.1587. Provide an interpretation of this result.
Solution:-
(a) The graph of a normal curve is symmetric about the mean, µ, and has inflection points at µ ± σ.
Determine the location of the inflection points.
µ – σ = 75 – 21 = 54
µ +σ = 75 + 21 = 96
The graph that is symmetrical about 75 and has inflection points at 54 and 96 is shown to the right.
(b) For the given normal distribution curve, the area under to the left of a value shows the percentage of cell phone plans that cost than value, and the area under the curve to the right of a value shows the percentage of cell phone that cost more than the value.
Since we wish to shade the region that shows the proportion of plans that cost less than  54 represents the percentage of plans that cost less than
 ![]() 54 per month, or the probability is 0.1587 that a randomly selected cell phone plan costs plan costs less than $54 per month.
54 per month, or the probability is 0.1587 that a randomly selected cell phone plan costs plan costs less than $54 per month.

