
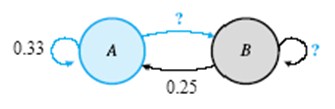
Is there a unique way of filling in the missing probabilities in the transition diagram? If so, complete the transition diagram and write the corresponding transition matrix. If not, explain why.
Solution:-
There are several conditions that must be satisfied in a transition diagram:
1) The number on each arrow is a probability; it must be between 0 and 1.
2) All the probabilities on the arrows from a state must sum to 1.
3) For each state, if there is only one arrow from that state with missing probability, and if the know transition probabilities from that state sum to 1 or less, then the missing value can be determined.
Therefore there is a unique way of filling in the missing probabilities in the transition diagram.
Figure out the missing probabilities so that all the probabilities from A or B sum to 1.
1) The probability of transition from A to B is 0.67.
2) The probability of transition from B to B is 0.75.
Write the corresponding transition matrix.
P = 
This doesn’t explain how do you get 0.67? and 0.75? you just pulled those numbers out without any explanation how to and where you got them?
Sum of probabilities A to A + A to B = 1
so 0.33 + A to B = 1
A to B = 1-0.33 = 0.67
Same as above
B to B + B to A = 1
B to B + 0.25 =1
B to B = 1-0.25 =0.75
Hope it will help.