
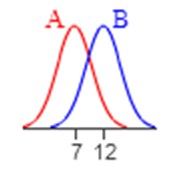
One graph in the figure represents a normal distribution with mean µ = 12 and standard deviation σ = 3.
The other graph represents a normal distribution with mean µ = 7 and standard deviation σ = 3.
Determine which graph is which and explain how you know.
Solution:-
Graph A has a mean of µ = 7 and graph B has a mean of µ = 12 because a larger mean shift the graph to the right.