
An environmentalist estimates that the mean waste recycled by adult in the country is more than 1 pound per person per day. You want to test this claim. You find that the mean waste recycled person per day for random sample of 20 adult in the country is 1.4 pounds and the standard deviation is 0.4 pound. At α = 0.05, can you support the claim?. Assume the population is normal distributed.
(a) Write the claim mathematically and identify  and
and  .
.
(b) Find the critical value (s) and identify the rejection region (s).
(c) Find the standardized test statistic.
(d) Decide whether to reject or fill to reject the null hypothesis.
(e) Interpret the decision in the context of the original claim.
Solution
(a) Write the claim mathematically and identify and .
Start by determining which parameter is being tested. The parameter being tested is the mean µ.
The claim is that the mean wasted recycle by adults in the country is more than 1 pound per person per day. The complement of the claim is that the mean waste recycled by adults in the country is less than or equal to 1 pound pre person per day. Recall that the null hypothesis contain a statement of equality. Thus, the null and alternative hypothesis can be stated mathematically as follows.
: µ ≤ 1
: µ > 1
(b) Find the critical value (s) and identify the rejection region (s).
Find determine which type of test is begin conducted. Since the alternative hypothesis contain >, the hypothesis test is a right-tailed test.
In order to determine the critical value, first determine the sample size n.
n = 20
next determine the degree of freedom d.f. Recall that d.f. = n – 1.
d.f. = 19
you can either use a t-distribution table or technology to find the critical value. For this explanation, a t-distribution table is used.
Use a t-distribution table to determine the critical value. Recall that α = 0.05 and there are 19 degree of freedom. Use the column labeled “One tail” for α = 0.05. Since this is a right-tailed
Test, the critical value is positive.
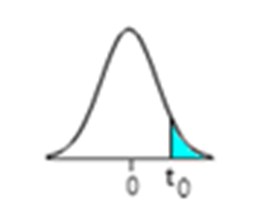
The critical value is  = 1.729.
Since this is a right-tailed test, the rejection region is the under the curve to the right of the critical value. The graph on the right shows the rejection region shaded in blue.
(c) Find the standardized test statistic.
The standardized test statistic is given by the following formula.

Start by identifying the sample mean  and sample standard deviation s.
= 1.4 ,s = 0.4
The value of µ is 1, the parameter being tested. Substitute the known values into formula for the standardized test statistic and evaluate.

 4.47
4.47
(d) Decide whether to reject or fill to reject the null hypothesis.
Compare the standardized test statistic to the critical value. If the standardized test statistic is in the rejection region, reject . If the standardized test statistic is not in the rejection region, fail to reject .
(e) Interpret the decision in the context of the original claim.
If the null hypothesis is reject then there is sufficient evidence to support the claim that the mean waste recycled is more than 1 pound per person per day. If you fail to reject the null hypothesis then there is not sufficient evidence to support the claim that the mean waste recycled is more than 1 pound per person per day.