Decide whether the normal sampling distribution can be used. If it can be used, test the claim about the population proportion p at the given of significance α using the given sample statistics.
Claim p ![]() 0.31; α = 0.05; Sample statistics : :
0.31; α = 0.05; Sample statistics : : ![]() = 0.26, n = 210
= 0.26, n = 210
Solution
To use the normal sampling distribution, both np and np must be greater than or equal to 5.
Begin by calculating np. The claim p < 0.31 implies the hypothesized proportion p = 0.31
np = 210 (0.31)
= 65.1
Next calculate np. First determine the value for q.
q = 1 – p
= 0.69
Use the value of q to find np.
np = 210(0.69)
= 144.9
Since both np and np are greater then or equal to 5, the normal sampling distribution can be used.
A null hypothesis is a statistical hypothesis that contain a statement of equality. The alternative hypothesis is a complement of the null hypothesis. It is a statement that must be true if the null hypothesis is false, and it contain a statement of strict of strict inequality. If the normal sampling distribution cannot be used, then the test cannot be performed.
The null and alternative hypotheses are given below.
![]() :p = 0.31
:p = 0.31
![]()
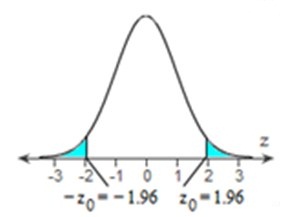
Determine the critical values using the fact that the test is a two-tailed test and the level of significance is α = 0.05. Find the critical values using technology, rounding to two decimal places.
The critical values are – 1.96 and 1.96.
Calculate the standardized test statistic z using the following formula.
![]() , where
, where ![]() = p and
= p and ![]() =
= ![]()
Substitute the given values into the formula and evaluate, rounding to two decimal places.
![]()
= ![]()
= – 1.57
The rejection region is shown to the right. If the standardized test statistic falls in the rejection region, then reject the null hypothesis. Otherwise, do not reject the null hypothesis.


Determine whether the normal sampling distribution can be used. The claim is p > 0.015 and the sample size is
Do not use the normal distribution.
Use the normal distribution.