Problem 95
The following data set gives the difference between the winning and losing scores in 50 randomly observed high school basketball games:
2, 12, 1, 2, 12, 5, 14, 2, 45, 9, 1, 8, 18, 28, 9, 4, 30, 16, 4, 12, 8, 13, 20, 9, 17, 13, 49, 17, 13, 4, 14, 2, 12, 29 ,8, 9, 11, 4, 6, 22, 4, 20, 23, 9, 14, 11, 8, 8, 2, 8
- Make a frequency of each score difference each score difference.
- Find the relative frequency of each score difference observed.
- Make a stem-and-leaf plot of the data from this experiment.
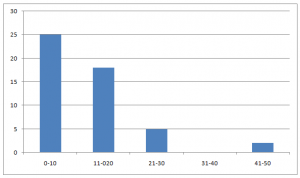
- Develop appropriate intervals and make a histogram for this data.
- Did you observe any clusters or outliers in the score difference date ? Explain.
Solution
Ans
- Frequency table
- See the table
| Difference (score) | Frequency | Relative frequency |
| 1 | 2 | 4% |
| 2 | 5 | 10% |
| 4 | 5 | 10% |
| 5 | 1 | 2% |
| 6 | 1 | 2% |
| 8 | 6 | 12% |
| 9 | 5 | 10% |
| 11 | 2 | 4% |
| 12 | 4 | 8% |
| 13 | 3 | 6% |
| 14 | 3 | 6% |
| 16 | 1 | 2% |
| 17 | 2 | 4% |
| 18 | 1 | 2% |
| 20 | 2 | 4% |
| 22 | 1 | 2% |
| 23 | 1 | 2% |
| 28 | 1 | 2% |
| 29 | 1 | 2% |
| 30 | 1 | 2% |
| 45 | 1 | 2% |
| 49 | 1 | 2% |
3. Stem – and- leaf
| Stem | Leaf |
| 012
3 4 |
2 1 2 5 2 9 1 8 9 4 4 8 9 4 2 8 9 4 6 4 9 8 8 2 82 2 4 8 6 2 3 7 3 7 3 4 2 1 4 18 0 9 2 0 3
0 5 9 |
4.
5. There were differences in the data, as data were increasing frequency is decreasing.

