
Problem 110
The data in the table are the number and percent of U.S. high students scoring in specific range on the Scholastic Assessment Test (SAT) in mathematics. Use these data to answer the following questions.
a. Make a histograph and circle graph, showing the percent of students in each of the scoring intervals.
Score Number Percent
750-800 15,912 1
700-749 44,384 4
650-699 72,552 7
600-649 96,865 9
550-599 107,532 10
500-549 136,586 13
450-499 141,916 13
400-449 149,453 14
350-399 131,509 12
300-349 112,414 11
250-299 47,625 4
200-249 11,245 1
b. Which graph in part (a) provides the better explanation for the distribution of scores on the SAT mathematics examination? Why?
Solution
a.
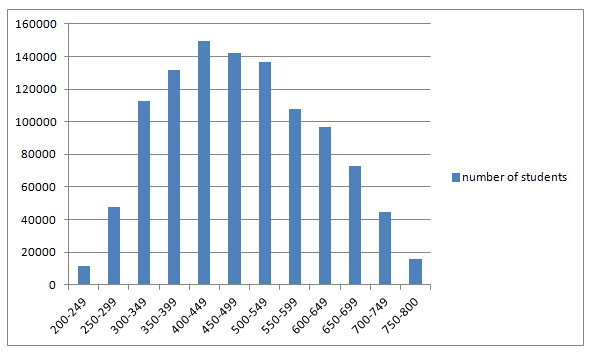
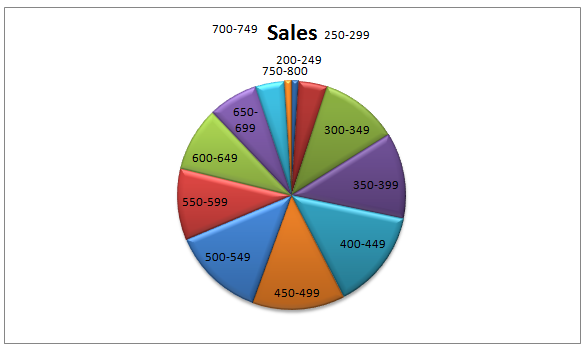
b. The histograph shows the data better than the circle graph. The histograph also is easier to understand. The distribution of the SAT scores can be seen in a better distribution than the circle graph