Problem 100
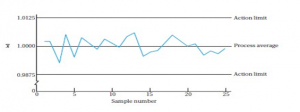
The chart below is an example of a quality control chart. Samples of parts and products are drawn from an assembly line and checked against engineering specifications. Write a short report describing the various features of the chart and the performance of the machine relative to the stated limits over time, as if you were preparing a report for the company’s chief executive officer (CEO).
Solution
This chart demonstrates the process average of the sample parts and products were pulled from an assembly line and checked against engineering specifications and that this chart demonstrates normalization of all the parts pulled.

