Problem 135
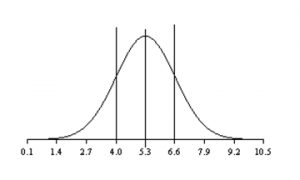
A study of motor vehicle rates in the 50 states reveals that traffic death rates (deaths per 100 million motor vehicle miles driven) can be modeled by the normal curve. The data suggest that the distribution has a mean of 5.3 and a standard deviation of 1.3.
Sketch the normal curve, showing the mean and standard deviation.
(Insert graph here – suggestion: Use the Word drawing tools. Use the curve tool)
Solution

