Problem 105
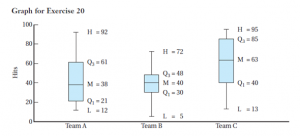
Data on the highest and lower number of hits by three baseball teams within a specified period of time are described by the next set of box-and-whisker plots.
1. Which team had the largest range? The smallest range?
2. Which team had the largest interquartile range? The smallest interquartile range?
3. For which team is the mean nearly equal to the median? Why?
4. For which team dose the mean most likely exceed the median? Why?
Solution
1. Team c has the largest range of 82. Team b has the smallest range of 67.
2. Team c has the largest interquartile range of 45. Team b has the smallest interquartile range of 18.
3. The mean is nearly equal to the mean of team b. The reason is because it is symmetric to the median.
4. Team a would be the team most likely to exceed the median. The reason is because the scores are above the median and not lower.

