Problem 97
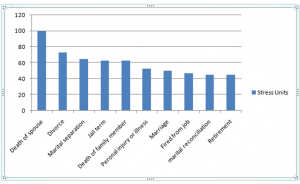
Select what you consider to be the most appropriate chart type for displaying the data. Develop and appropriately label the graph. Then write a short paragraph justifying your selection.
Stress Units of Various Life Experience
Experience Stress Units
Death of spouse 100
Divorce 73
Marital separation 65
Jail term 63
Death of family member 63
Personal injury or illness 53
Marriage 50
Fired from job 47
Marital reconciliation 45
Retirement 45
Solution
I would use bar chart to display the given data.

